MyConnection Server
To The Customer, The Experience Is Everything
You are here:   Visualware >   MyConnection Server >   Resources >   Identifying a Network Route Problem

Solving Network Problems with MCS
Identifying a Network Route Problem

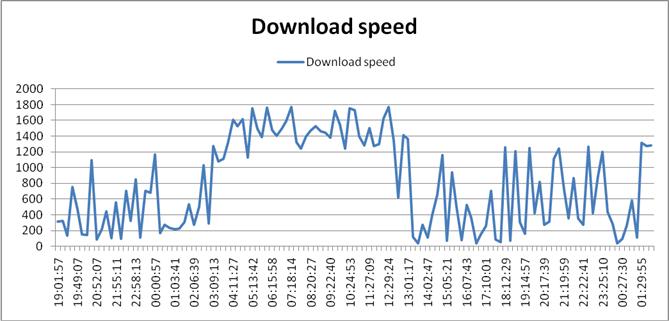
Network assessment testing for this analysis was performed with MyConnection Server and the AccessCT appliance. Connection tests were performed every 15 minutes over several days to capture network capacity and performance over time and during both peak activity periods and low activity period.

The problem is clearly shown is a report of the download capacity over several days, which shows very limited throughput ranging from 0 to 1.8Mbps.


Fig. 1 MCS report shows download capacity is below 1800Mbps.

What is interesting is the good vs bad goes 00:00 (your time) to about 12:00pm (your time) which is unusual.

To investigate further, a look at the connection route shows poor route performance, particularly in light of the high latency for a network hop in a nearby location.

The problem is the peering point between the Rapid and AT&T networks (hops 2 and 3), the 170ms latency is long enough to cross the Atlantic and back, a trip time of 200ms could almost cross the Atlantic 3 times. However, hops 4 and 5 are in the Los Angeles area, which is still near the origination in southern California. The abnormally high latency points to a problem with the AT&T network, this could be a problem with the peering point itself or a problem with the routing tables that is sending the data to device a long distance away.


Fig. 2 The connection route report shows abnormally high latency for a hop that should be located relatively close to the start location.

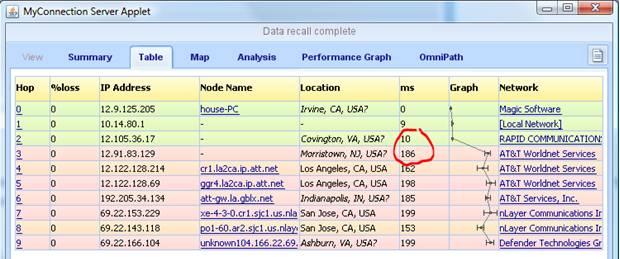
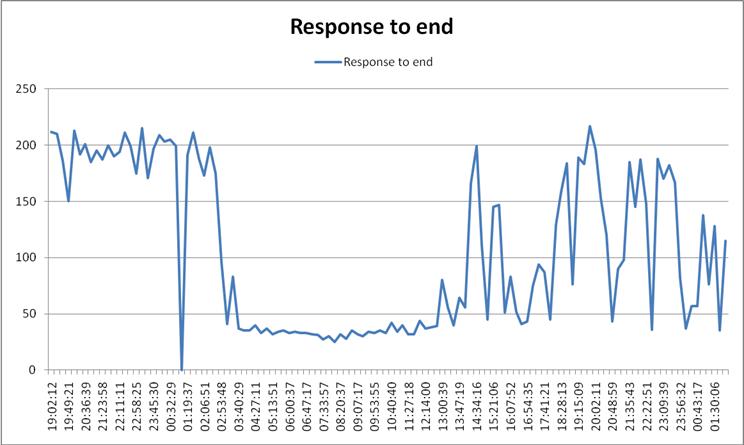
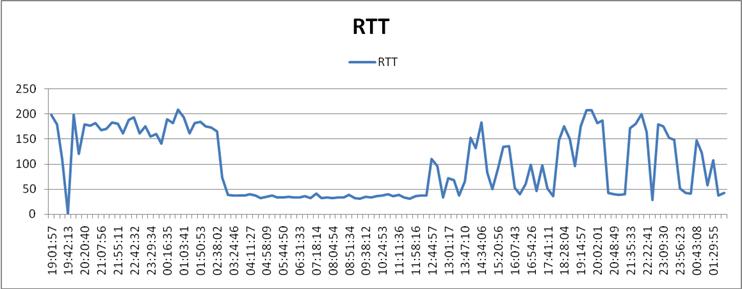
If you then map the route performance over the time windows the correlation is precise to the speed test trip analysis.


Fig. 3 A report of the response time shows a close inverse relationship to the download capacity (Fig. 1).


Fig. 4 A report of the round trip time shows an inverse relationship to the download capacity (Fig. 1).

In conclusion, it is evident that something is burdening the network, that originates in a time zone 6-8 hours different, could be Europe or Asia. This theory is based on the 00:00-12:00pm window, as a normal congestion pattern would be during the daytime hours while, ie. 8am-6pm.

This information should be enough for the ISP to address the situation.


See more examples of solving network problems with MCS


MyConnection Server

Home
Online Testing Portal
Download
Purchase
Resources
Support

Visualware Products

VisualRoute
eMailTrackerPro
Visual IP Trace


© Visualware Inc. 2014 - All Rights Reserved