|

Support Overview |

Tutorials |

Usage Examples |

Upgrade Information |

FAQ |

New Release History |
| You are here: Visualware > MyConnection Server > Support > Online Manual Overview > MyIPTV Test | |||||
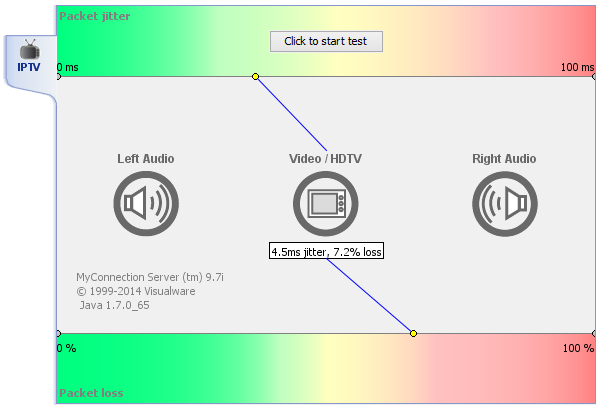
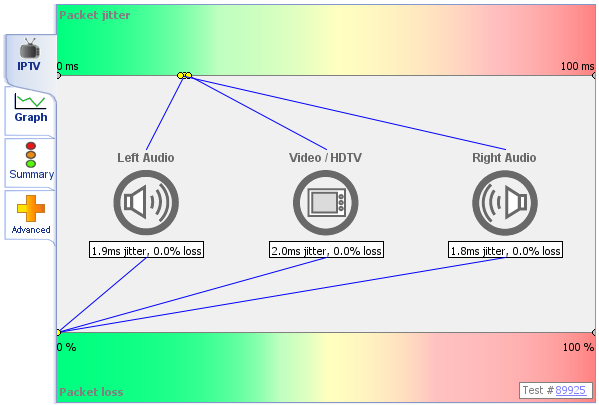
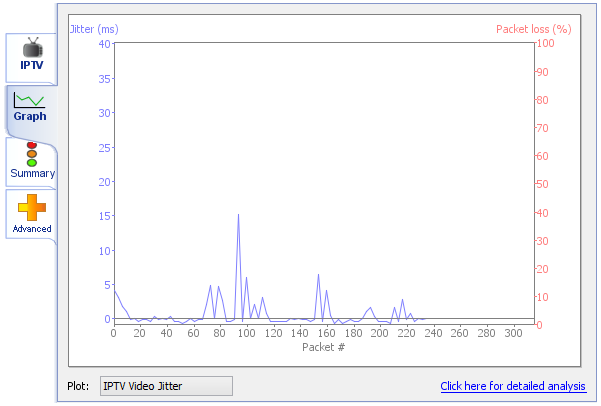
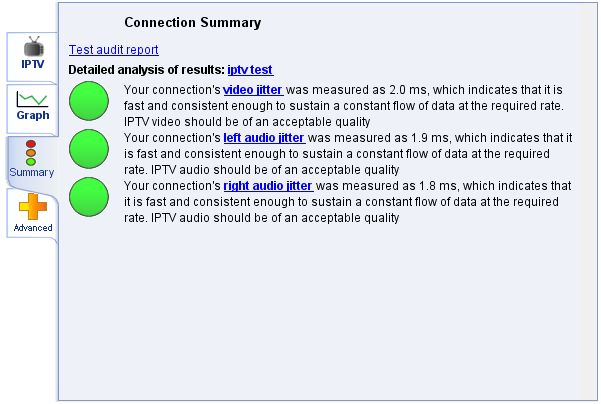
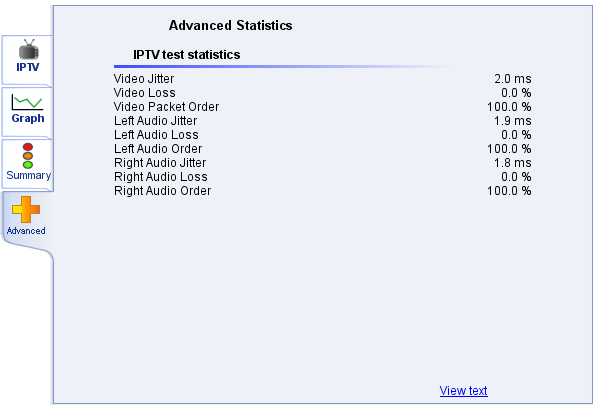
MyIPTV Test |
|
Home |
|||