Support Overview

Tutorials

Usage Examples

Upgrade Information

FAQ

New Release History

You are here:   Visualware >   MyConnection Server >   Support >   Online Manual Overview >   MySpeed Test

MySpeed Test


Sub section menu:

There are four tests that can be performed. The different tests are explained below:

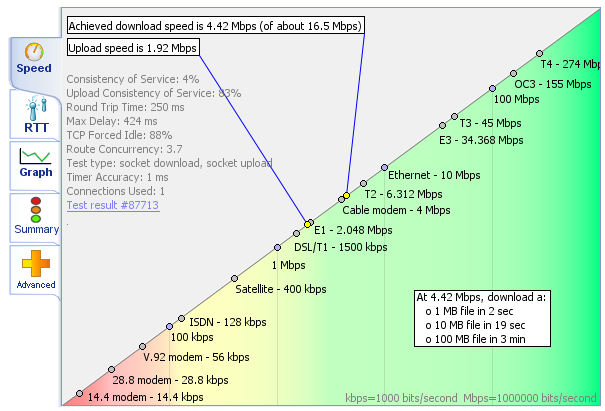
Application Speed - Application speed is performed over a single connection thread and measures the actual real end-to-end speed that a TCP application will achieve for the connection being tested.

Capacity Speed - Capacity Speed tests a connection over multiple connection threads and is not usually a measure of how a connection will perform when used for most web applications, for example to view a video or listen to music.

HTTP - MySpeed provides two test methods for the bandwidth test: TCP socket-to-socket and HTTP. The socket-to-socket download and upload speed tests provide the most accurate speed tests available.

Basic - A standard speed test with no extra data (tabs).

To BEGIN THE TEST click the CLICK TO START TEST button.

Completed Test

First of all the download test will be plotted followed by the upload test. Once the test has been completed more tabs will appear and the results will be displayed as shown on the right..

RTT (Round Trip Time) Consistency Tab

The RTT (Round Trip Time) tab, shown on the right, plots the reponse times in a bar chart view for each of the packets sent out during the test.


Graph Tab

The graph tab plots your download or upload speed in kbps (chosen from the drop down menu) vs the connection delay in ms and the time the test took in ms.

The graph's you can view are explained in much more detail by clicking the "click here for detailed analysis" link in the bottom right hand corner of the applet. This link appears on the summary and speed view as well.


Summary Tab

The summary tab shows a summary of the connection data collected from the test. The colored circles to the left of the text are there to give a quick indication as to whether the test was good or bad. In the example above the download and upload tests are of a good speed but the quality of service is bad which means although the speed was good, it was not consistent.


Advanced Tab

The advanced tab, as shown on the right, shows a run down of the statistics for the test performed.

The data ranges from the download and upload speed to the average download pause and average round trip time to server.

If the statistics don't make much sense or were not expected then try viewing the detailed analysis which explains things in much more detail. (there are link to this report in the speed, graph and summary tabs, but not the advanced tab)


MyConnection Server

Home
Online Testing Portal
Download
Purchase
Resources
Support

Visualware Products

VisualRoute
eMailTrackerPro
Visual IP Trace


© Visualware Inc. 2014 - All Rights Reserved