1. Start - Very simply clicking the start button will restart the traceroute just performed.
2. Tools - The tools menu allows you to easily start another type of test, either for the current host or one of the other hosts uncovered during the traceroute. As you can see in the image below each hop is listed with the feature options to the right hand side. Clicking any option in this menu will start the new test in a new tab.
3. Run options - This drop down menu you allows you to either run the test once, run the test every x minutes or run the test continuously.
4. Views - The buttons in this section represent each of the panes available (Analysis, Map, Route Graph, Table, Traceroute Ping Plot, History and OmniPath).
5. More - The more drop down menu allows you to add a pane to the current view from another traceroute. See the example below:
If you wanted to compare two route graphs from similar traceroutes (both traceroutes have to be open) then you would simply click the more drop down menu, locate the traceroute you want to compare, then click the route graph icon. This would add the pane to your current view.
Drag and Drop
You can drag and drop a pane in order to change its position. The image below shows a pane that is being dragged. Faint arrows will appear to show where you can drag the pane too.
This is very useful when you have every pane open. In this instance the best setup is to have two panes side by side instead of them all on top of each other.
Another clever feature of VisualRoute is the ability to initiate various tests from almost anywhere within the results. For example right click on a node name or an IP address within the table pane, route graph pane or the OmniPath pane and you will get a list of further analysis options, as shown below:
A new test can then be initiated by clicking any one of those menu options.
More Tools
The more tools drop down menu towards the end of the main toolbar allows you to start a test other than the standard traceroute. The options from left to right in the image below are traceroute, continuous traceroute, plot response times, port probe and network scan.
These extra options are defined by which version you have purchased/trialing, for a feature comparison click here.
Trace from
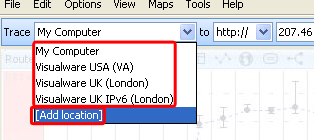
VisualRoute allows you to trace from 4 default locations. These are your own computer, a Visualware server in the USA, a Visualware server in the UK and and IPv6 Visualware Server in the UK.
| Support Pro Edition Only: The add location option (shown above) allows you to add your own location using a small piece of software called an OnDemand NTA. Choosing the add location option will launch a browser and open the Manage Trace From List page of the VisualRoute server, you will need your admin username and password to access this page. For more information on creating and deploying an NTA click here. |
|


