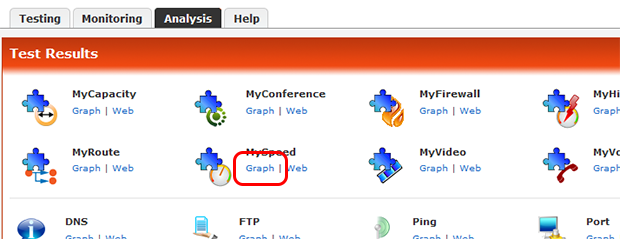
The same data as the web reports is also available in graph form.
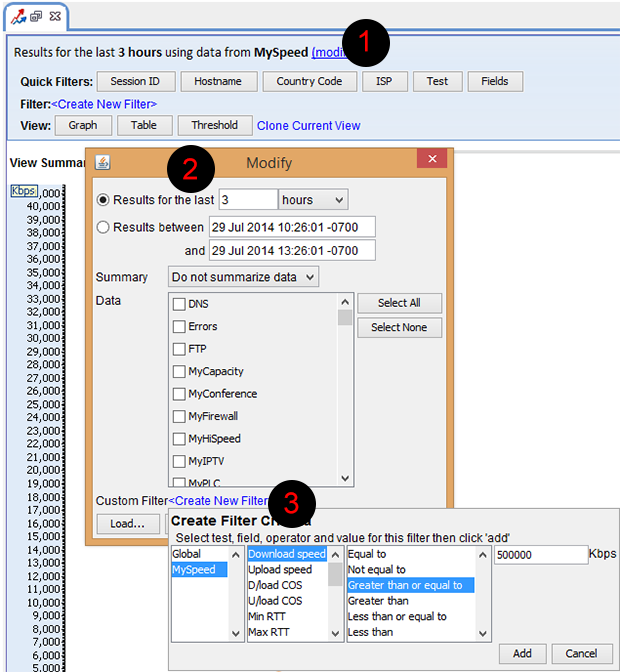
Firsly the basic graph options are shown on the right.
1: Click the MODIFY link to bring up data options (2) like time frame, test type, summariztion and filters.
2: This dialog allows the user to configure the graph view. The same data is available as in the web reports.
3: The CUSTOM FILTER section allows the user to filter results at a more advanced level. In the example on the right a filter is about to be set that only shows MySpeed results where the download speed is greater than or equal to 500,000 Kbps.
At the bottom of dialog 2 there is an option to SAVE or LOAD. As some filters can get quite complicated it can be useful to save them for future use.
The QUICK FILTERS section, shown just under point 1 on the right, allows the user to quickly edit the data in the graph without modifying from scratch. |